Using LiDAR
I recently wrote this article for CompassSport Magazine and thought it'd be a good one for the website too.
LiDAR has revolutionised mapping in the last 15 years or so, but the increase in accuracy comes with risks too.
Light Detection and Ranging surveys involve planes or drones using lasers (i.e. light) to very accurately measure the height of the ground. Cleverly, they can also distinguish between the lasers that reflect off the tops of the trees (or buildings or cars etc.) and those that reflect off the ground.
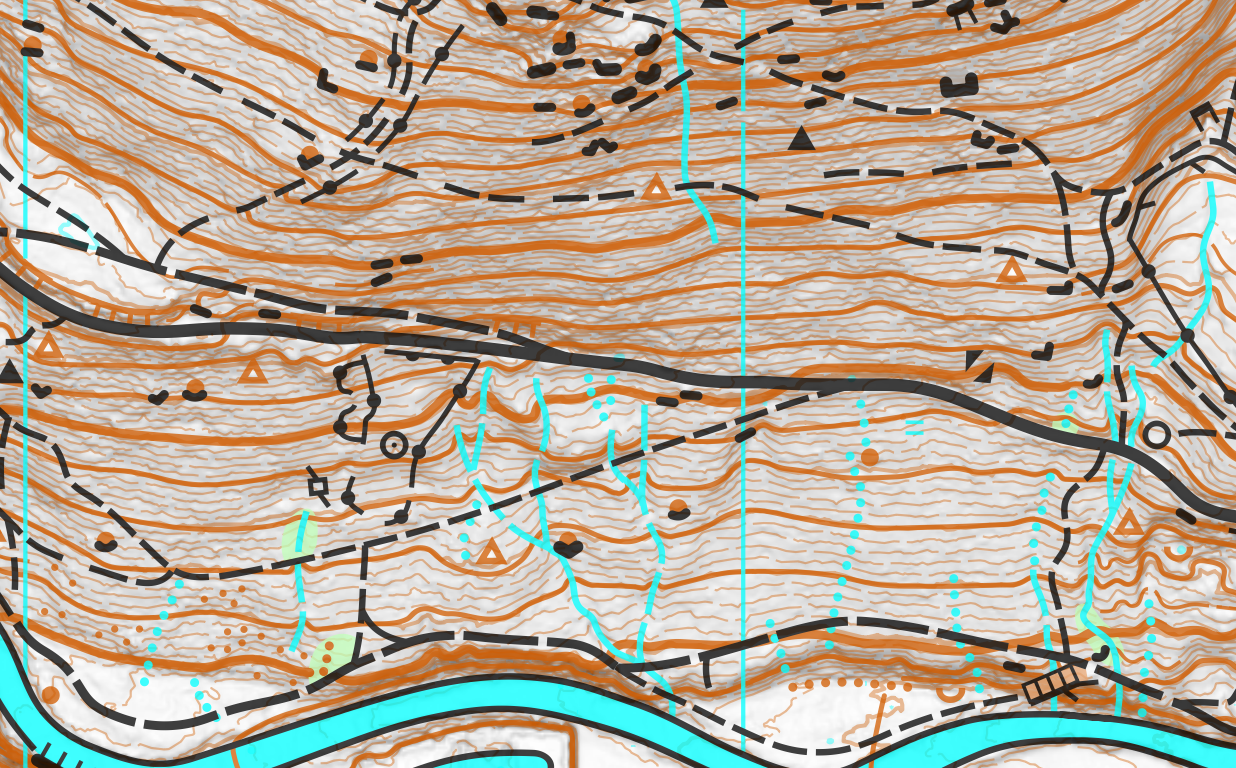
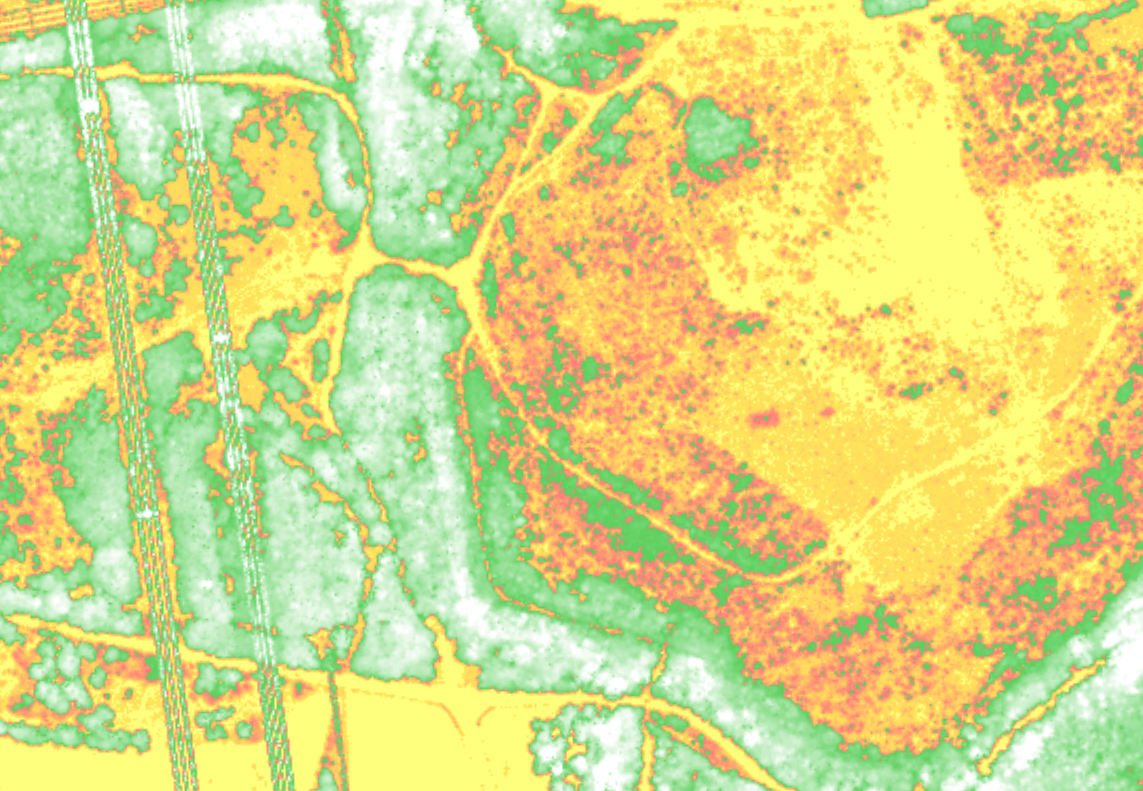
You can get a few different things from the LiDAR data. Firstly, and the most obviously, contours. Secondly, the ‘slope gradient’ - with steeper slopes shaded darker, which is really useful for seeing crags, knolls, pits, and the general shape of the land. Thirdly, the vegetation height, useful for boundaries between different sections of forest, clearings and lone trees in open areas. There are more things you can generate but these are the ones I find myself using most. To process the raw data and generate these things, OCAD has a nifty tool, it’s also possible in (free) GIS software if you know how, and there is other O-specific software such as Karttapullautin that can do it too.
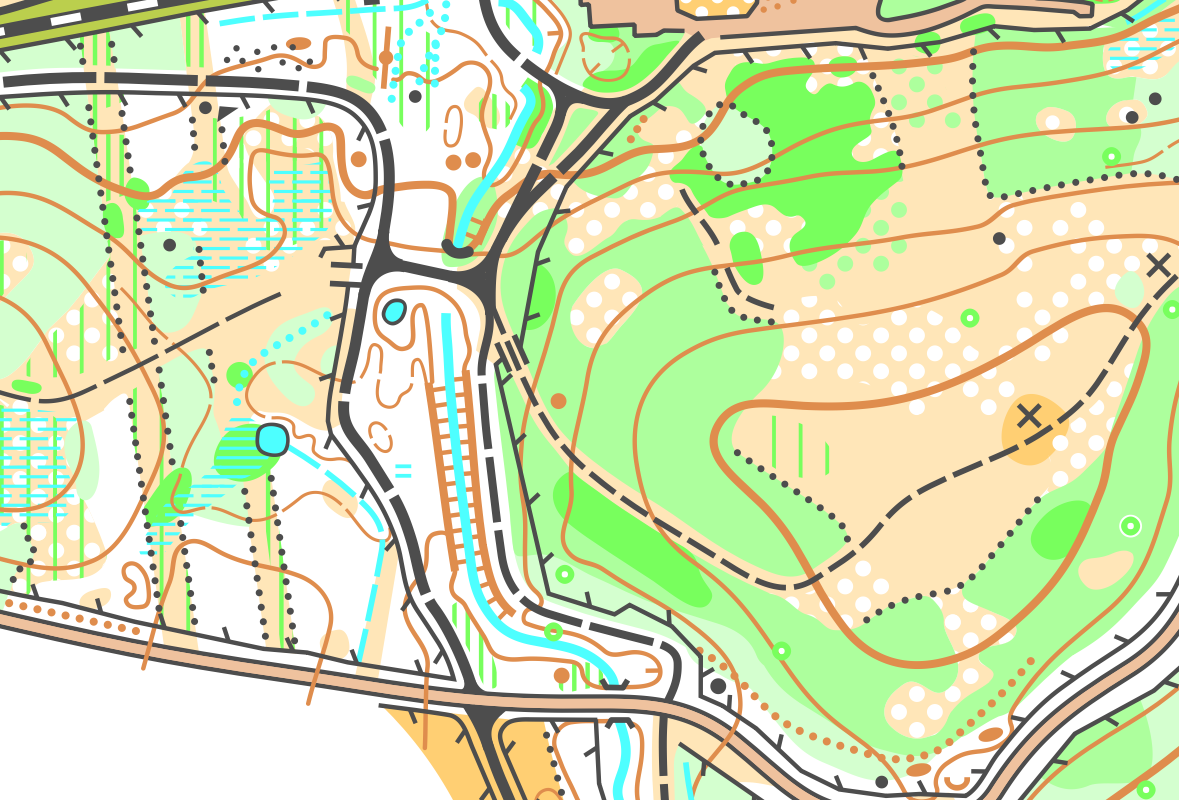
For the complete beginners out there, most of the time when you’re making a map, you’re drawing the O map symbols over the top of background maps. OS map in the background, trace roads over the OS roads. Satellite image in the background, trace out a lake where you see a lake. I’ll briefly say that you can automatically convert some things from background maps into O map symbols, but the difference between a nice map and a bad map is in the drawing… It’s the same with LiDAR. Auto-converted things will break ISOM in many many places, so it’s not advisable for maps that will be used for events. Drawing things manually is the way to go, but there are still risks to be aware of.
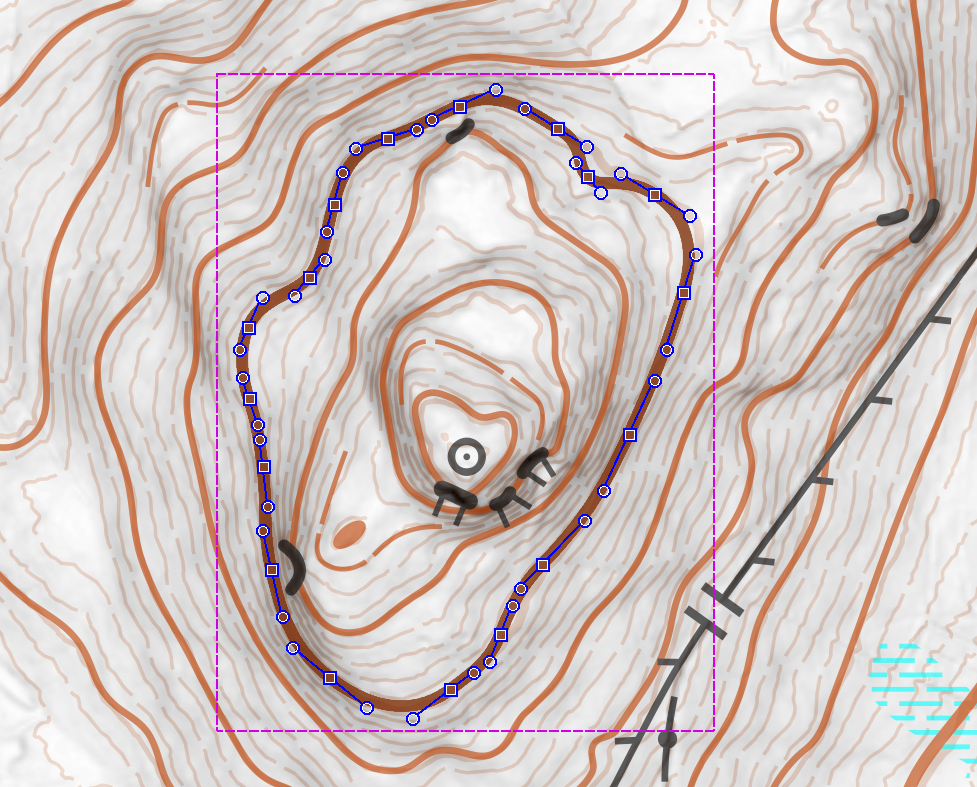
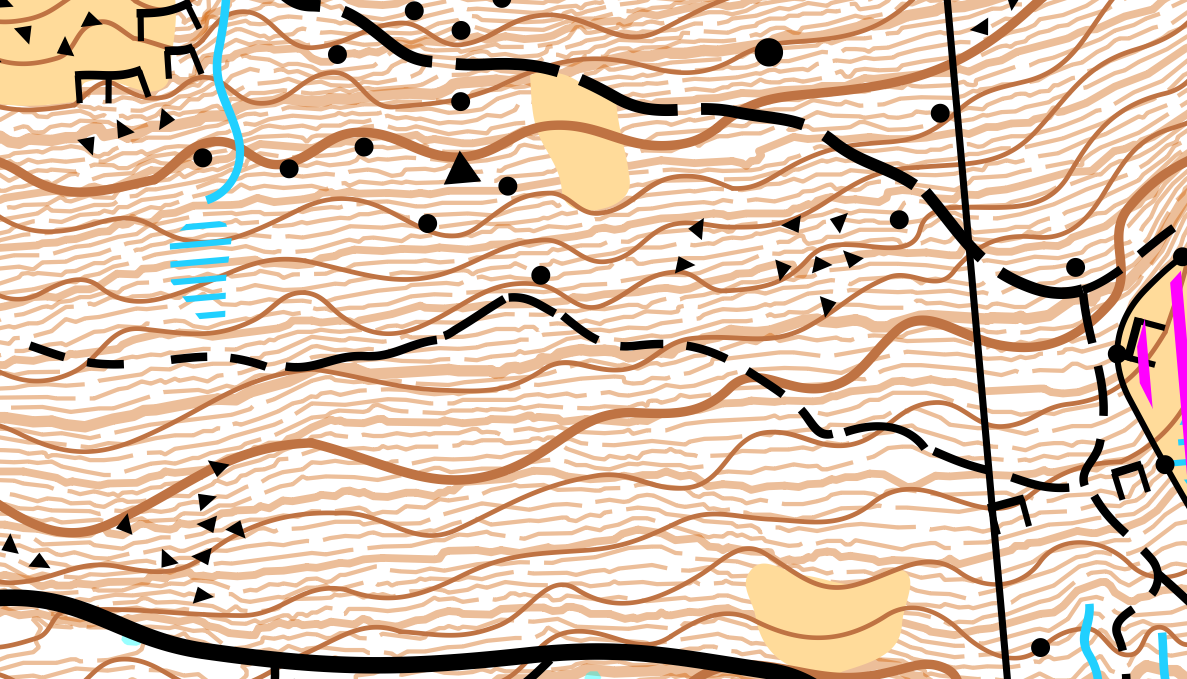
The main risk of using LiDAR is that, because you see every tiny detail, you include them all on the O map. The right balance between accuracy and legibility can be tricky to find - it’s oh so easy to zoom in a little too much and include too many small details. It is also very easy to end up with form lines between every contour, because you see that there are small features and slight deviations in the 2nd or 3rd of the 1m contours (and you’ve drawn contours on the 0th and the 5th). Form lines should only be used when the contours can’t fully describe the shape of the land correctly. However, it is allowed, and in fact encouraged, to have +-1m of flexibility in the contours. This lets you exaggerate features that are obvious on the ground and include crags without introducing too many extra form lines.
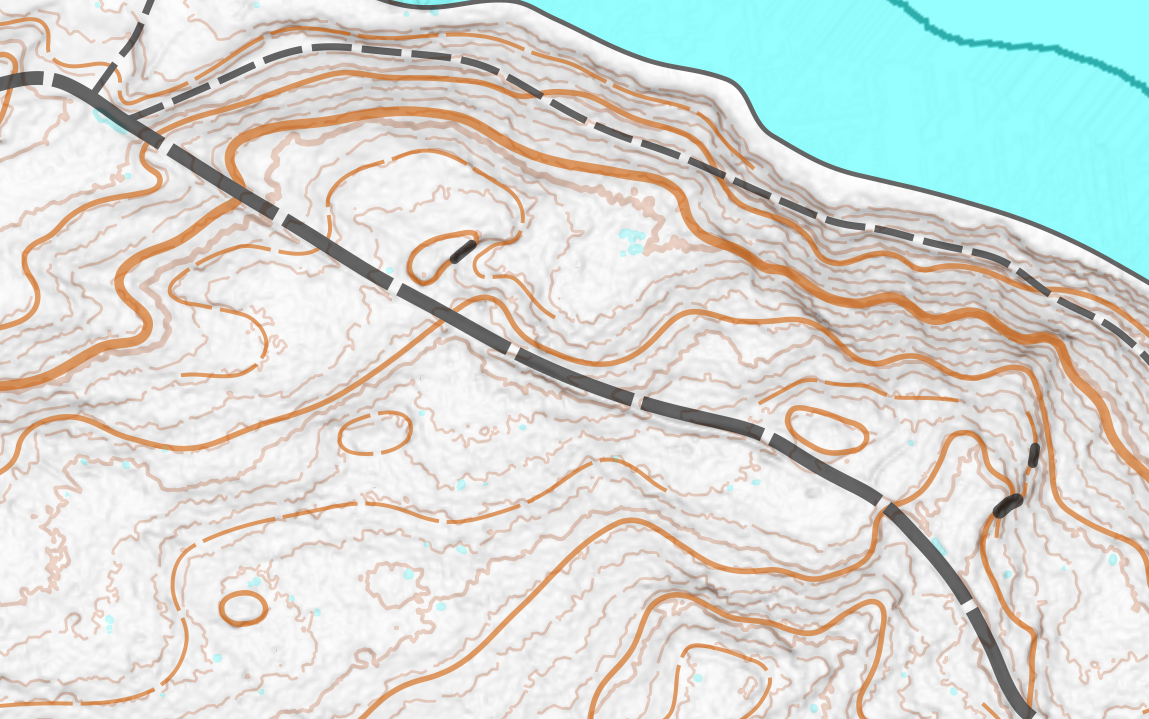
Using the slope gradient, you can see things other than contours too. Roads and tracks that have been levelled, ditches, gullies and charcoal burning platforms are all usually visible. However, my advice, especially if you are starting out, would be to err on the side of drawing fewer features from home before you do fieldwork. Once you are in the terrain, it’s better to see the features on the ground and then place them using the LiDAR, than to go out hunting for features that you have first seen on the LiDAR.
Along with the slope gradient, the vegetation height is the other very useful LiDAR derived base map. Boundaries of felled areas, clearings and copses are all very clear. However, there are again risks of overusing it. Firstly, ask yourself: Does the height of the trees in a patch of forest correlate with the runnability? The answer is that is does, but only loosely, with a lot of variation. In undisturbed spruce platations on flat ground it can be quite reliable, but in the UK especially there are often many more factors that influence the runnability. Projects like MapAnt and Karttapullautin auto-convert the vegetation height (and perhaps the density sometimes) to give a best guess, and they are generally ok for exploring a forest on your own, but not good enough for events. Secondly, the mapper must remember that the runner does not run with their eyes up to the sky. So, clearings which look big and obvious from the LiDAR, may not be so obvious to the runner, and similarly with vegetation boundaries. On the flip side, a top tip when looking for a clearing in a race on a LiDAR-based map is to look upwards… Thirdly, you have to keep in mind that the LiDAR data you’re using may have been collected a few years ago. It will tell you when you download it. Trees can grow a significant amount in 5 years, and recent storm damage and forestry work may have happened in the meantime too.
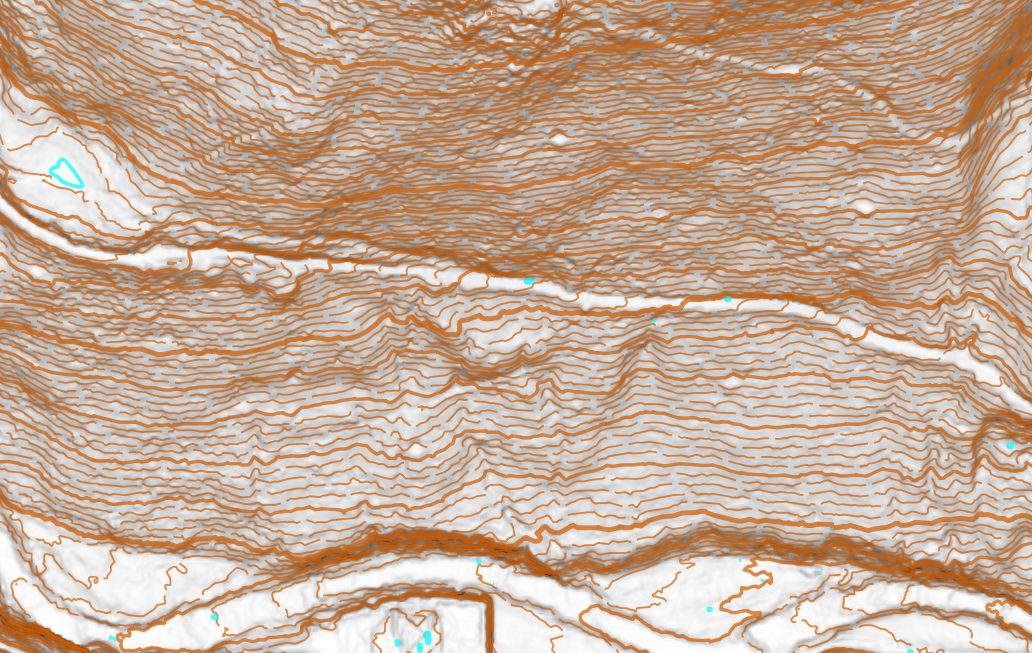
Before LiDAR, the best elevation data we had was photogrammetry based - basically aerial photos taken from different angles. Then using a special machine and a lot of skill, one could draw contours from these photos. However, the best you could get would be the heights of the tops of the trees, and on steep forested slopes things could get rather weird…
So, LiDAR is clearly a big improvement, but don’t let the precision available lure you into making messy and illegible maps!