Hardcastle Crags

The upper Calder Valley and its off-shoots are all very steep, very narrow and mostly wooded. And, usually, heavily populated and industrialised. Between the valleys are wide, flat moors, a mixture of tussocks and heather. The majority of the orienteering happens on the moors, for example at Castle Carr, used for Northern Champs 2013, about 80% of it is actually Midgely Moor, and the courses just dipped into the semi-wooded valley at the end.
However, up the valley from Hebden Bridge lies Hardcastle Crags, a huge wooded valley owned by the National Trust, which is surprisingly bramble-free, and in the winter, also bracken-free. Despite it only being about 5km from my house, as a child I never orienteered there. A map did exist, but it was very old and I was under the impression it wasn't particularly good.
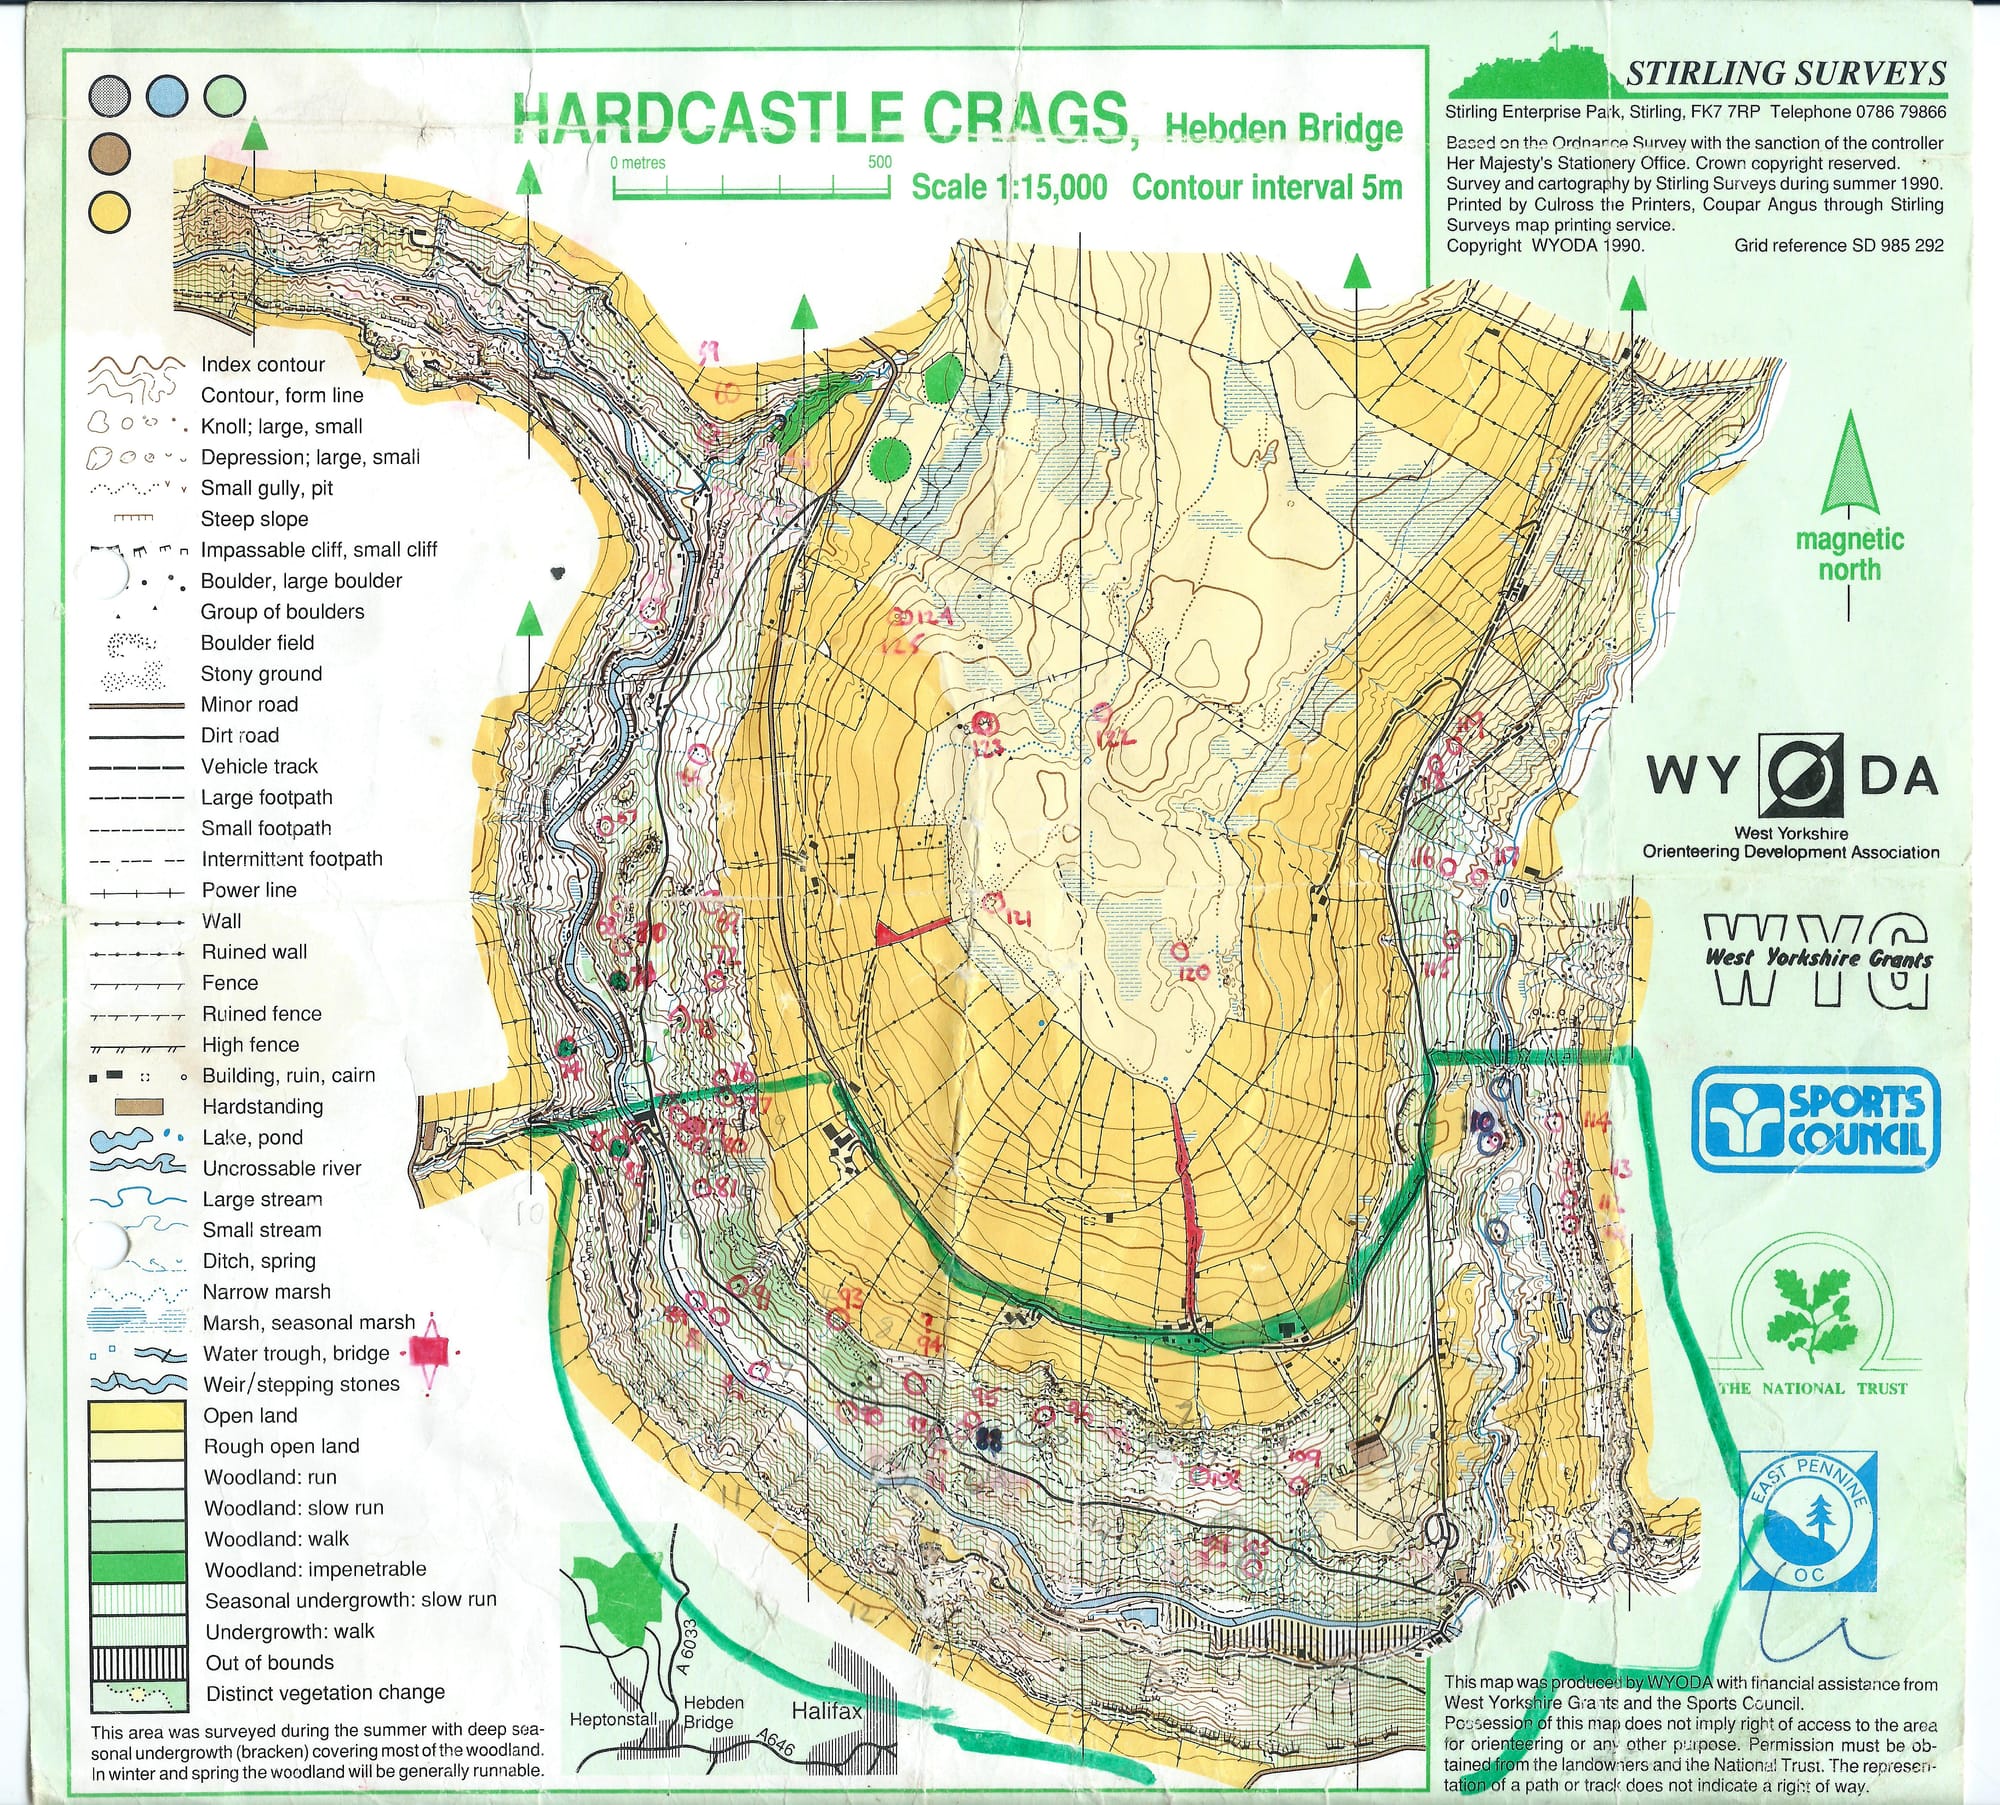
The old map includes the moorland in the middle, but we were unsure about access so decided to just do the woods for the new map. The old one was made in 1990 by Stirling Surveys, and the 1:15,000 paper copy I have is actually really nice and legible - for example they did a great job of keeping a nice separation between parallel paths and walls/fences. However, it is blanketed in green stripes because they surveyed it in the summer, when the bracken was high, which I think also means some features might have been missed, invisible under the bracken.
I spoke to a few people to see if a digital version existed anywhere, but to no avail. The only digital old map I had was a 2011 version of a much smaller area:
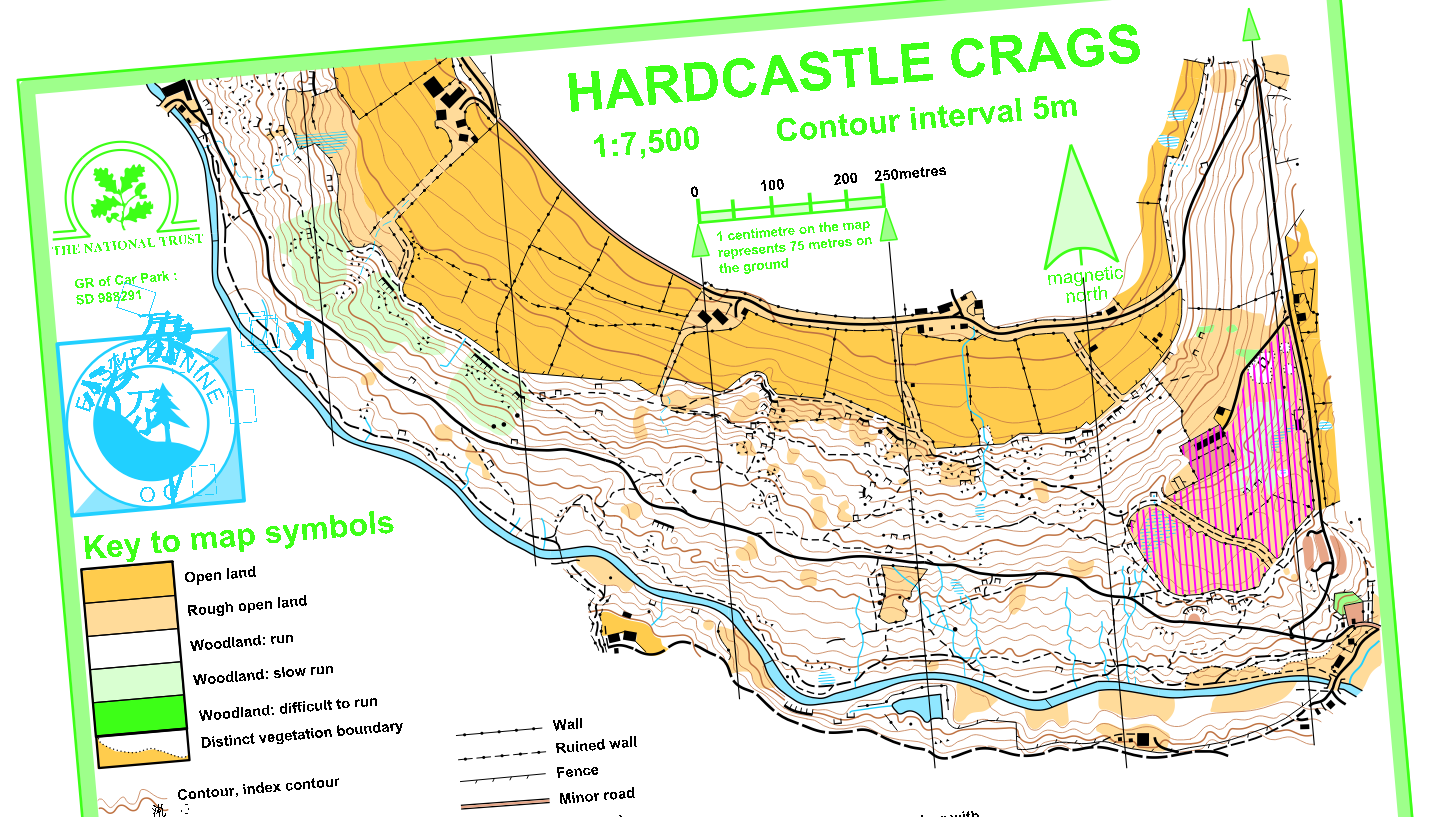
I was really excited to be working on it, and intrigued to see how the LiDAR would agree with the old contours, which I assume were from a PG plot but the map doesn't say. It's fair to say they didn't agree particularly well...
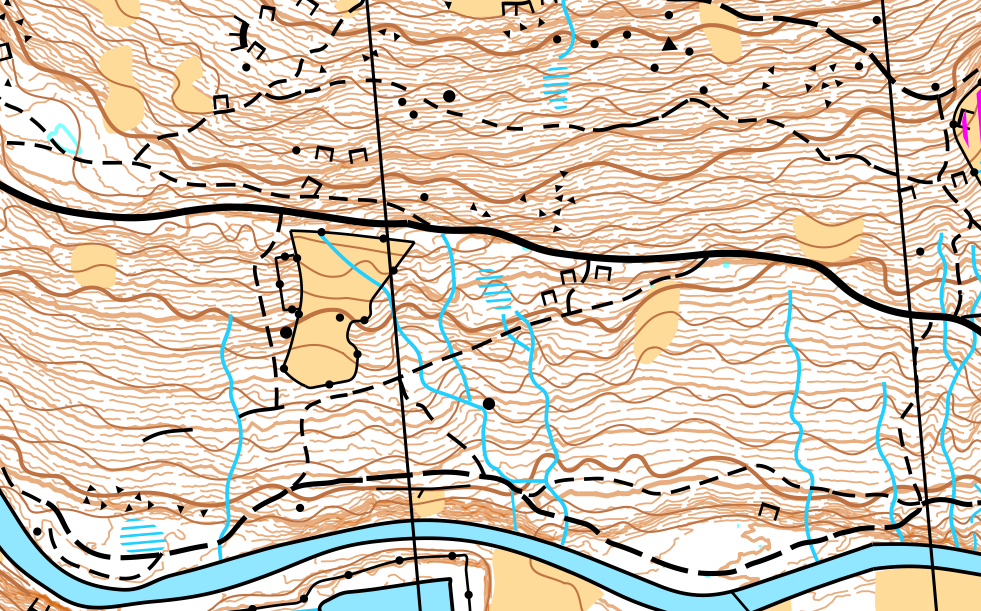
As you can see, the old map has contours which look like waves on the sea, whereas in reality the slope is pretty flat. They're not even exaggerating slight re-entrants, most of them are completely fictional. So, I didn't use the old map for any help with anything contour-related. I think the only things I used it for, and this was only pre-fieldwork, making a base map, were a few streams and indistinct paths - I marked them on as reminders to myself to go and check them.
I drew all the contours before starting fieldwork, then edited them when I was out in the field. I'm more used to doing that than drawing them from scratch when out in the field. The major paths, rivers, fences and walls could be done from home too, from a combination of OS maps and LiDAR (LiDAR is more accurate, so you use that, but sometimes you can't tell if something is a wall, a path or an earthbank so you check with the OS map).
With LiDAR, as I've talked about on here before, you can get Slope Gradient and a Vegetation Classification maps. In a forest, I am still rather skeptical about using the vegetation LiDAR to give you anything useful in terms of greens, but it can be useful for clearings.
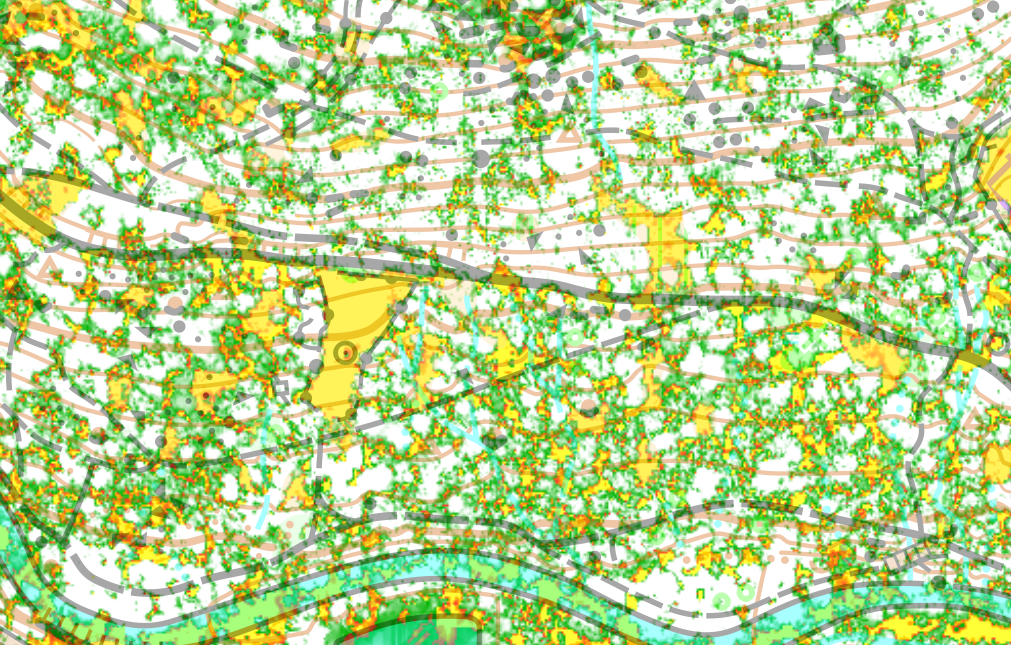
When out surveying, I'd have the LiDAR contours up faintly the whole time, and then often bringing up the Vegetation Classification and the Slope Gradient as and when needed.
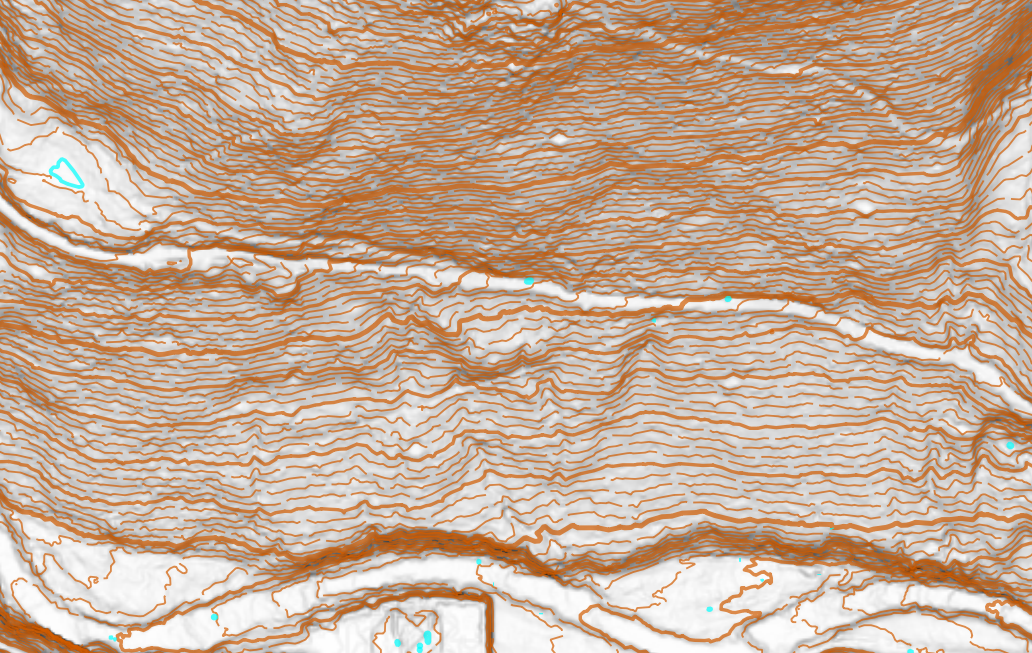
On the slope gradient you can often see the paths which was really helpful, as they can be surprisingly hard to map accurately - OS maps and GPS often aren't accurate enough.
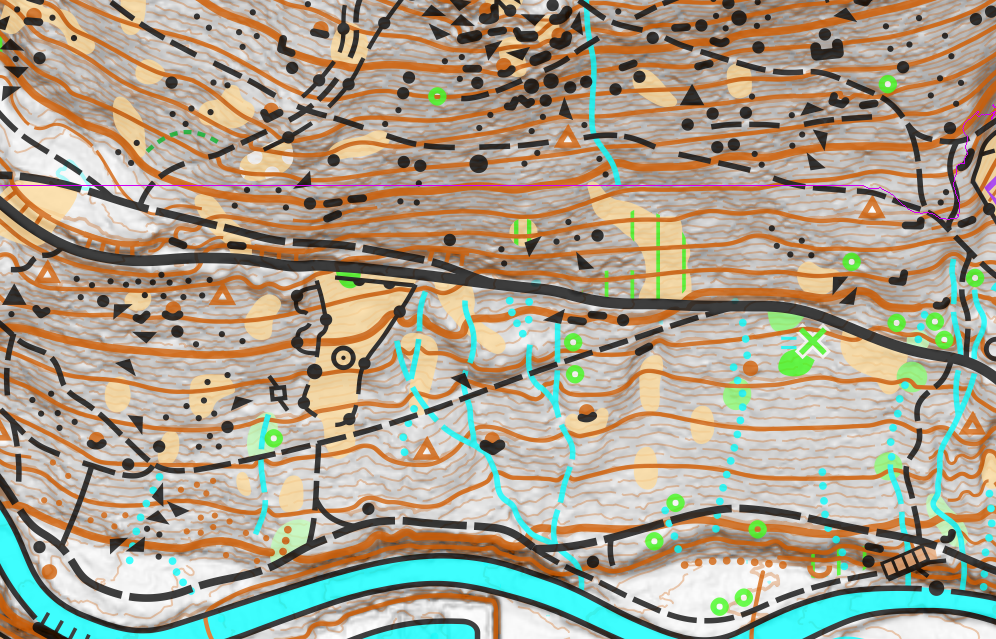
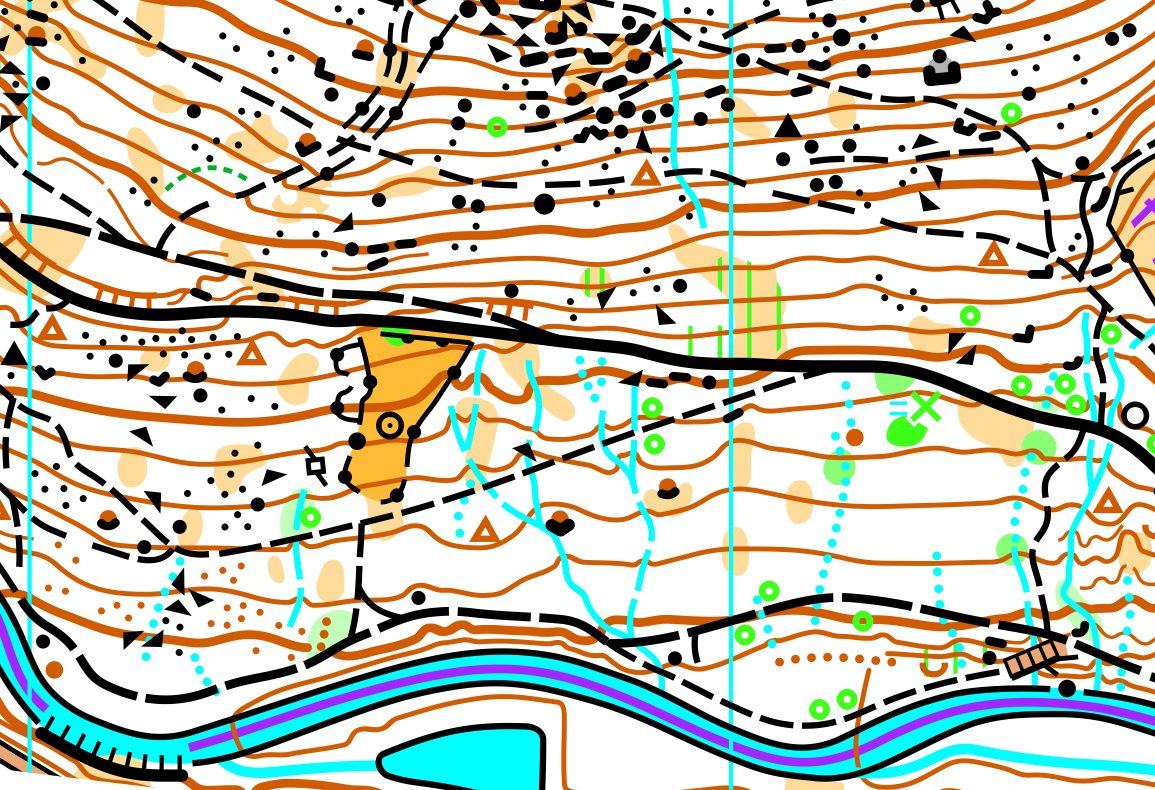
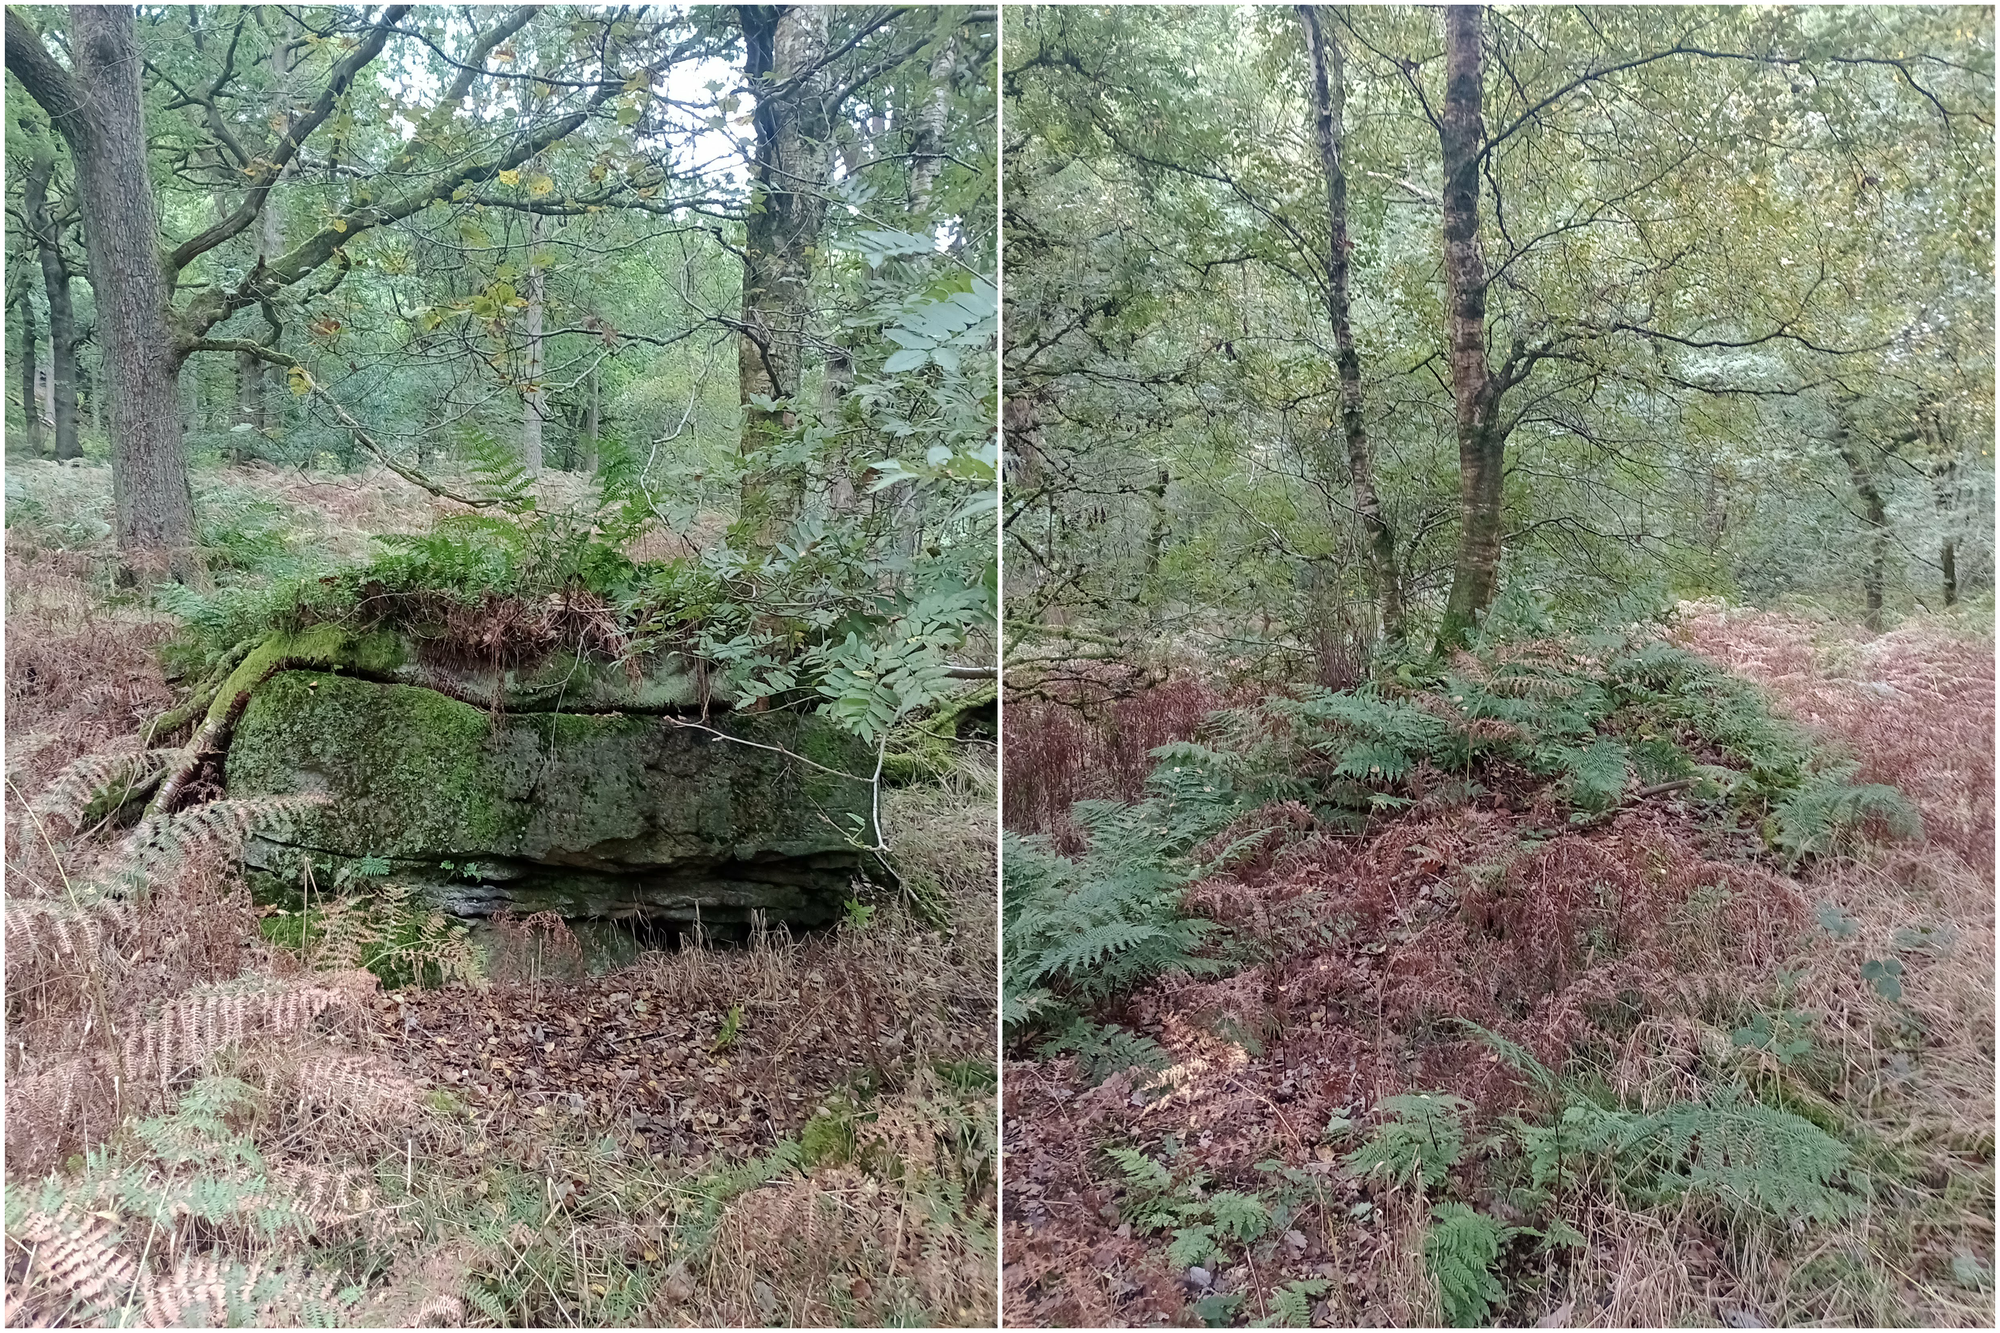
The biggest mapping challenge was the rock. The lines between crags, boulders, boulder clusters, boulder fields, stony ground, broken ground and knolls were all blurred. The main feature of the area is rocks embedded into the hillside. I decided that if it's embedded enough that it is not obvious from above, it's a crag, potentially up to 3-sided. If it does have some significant height looking from above, it's a boulder, or occasionally, if it's a non-rocky lump looking from above, a knoll with a crag on one side. However, if there are so many similar rocks that I can't fit them all on individually, then it's a boulder field. Sometimes I was wishing there was a "scattered crags" symbol. If the rocks are smaller and scattered on the floor, it's stony ground. If a boulder is covered in vegetation so it no longer looks rocky, it is a knoll?
I did my utmost to put every crag on a contour, which often needed some careful thought. I also had to bend contours quite significantly sometimes to get them to avoid the platform symbols, which aren't technically meant to touch contours, but sometimes that was unavoidable.
Because I was using quite a lot of stony ground, I decided to opt for the green dashed vegetation boundaries. I also mapped (most of) the distinct holly bushes. In hindsight maybe they add some unnecessary clutter, but I'm not sure.
There was some discussion about uncrossable features. According to ISOM (forest mapping spec) and the IOF rules, there are no rules against crossing 301 Uncrossable Body of Water (or any other non-purple symbol for that matter). Yes, even if you tell people in the final details, what the map says goes in the event of a disagreement. So, we decided I should put a purple line down the rivers (and along the fences we didn't want people crossing).
In total, it was 10 days of fieldwork, which looked like this:
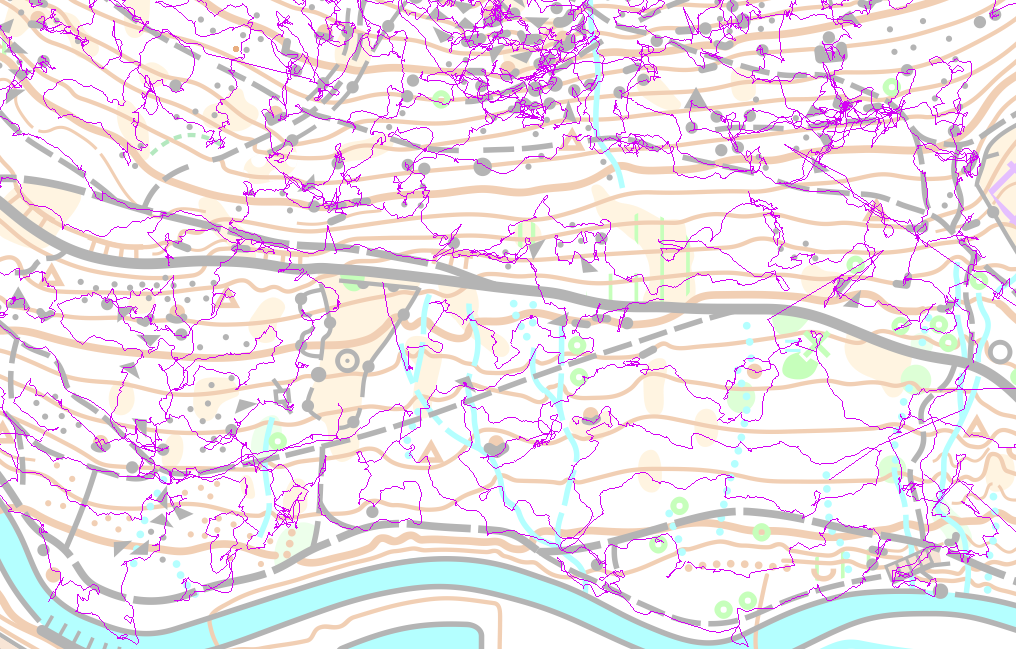
The GPS wasn't really accurate enough to be using for mapping - if I could, I'd use one of the forms of LiDAR to position myself/the symbols. The other thing it shows is how much time I spent in those boulder fields, I really wanted to show as much as I could individually, if I could do it legibly and fairly, rather than just scatter-gunning boulder field everywhere. I did my best to keep the ISOM-specified minimum gaps between symbols (which I used a little purple dot to help me with), so I'd hope it would be legible at at least 1:10,000. In the end 1:7,500 got used for all the courses in the event, so hopefully it was nice and easy to read.
I hope you enjoyed running on the map! It really was a pleasure to spend so much time in such a nice forest, which I hadn't previously been to as much as you might think - this is the map I wish had existed when I was growing up! If you weren't at the event, the full map will be on PFO's Routegadget, and/or EPOC's Routegadget.
Last but not least, a big well done to Graham and Jon from EPOC for Planning and Controlling, and Hannah, Andy and the rest of the PFO team for Organising.