Scalpay

Updated 11th July 2023: This was my first professional mapping project, and this write-up was done after making the map in October 2022. So, it's written with more of a beginner's eye. I've added some bits in italics to reflect my current thoughts, after 9 months of further mapping experience.
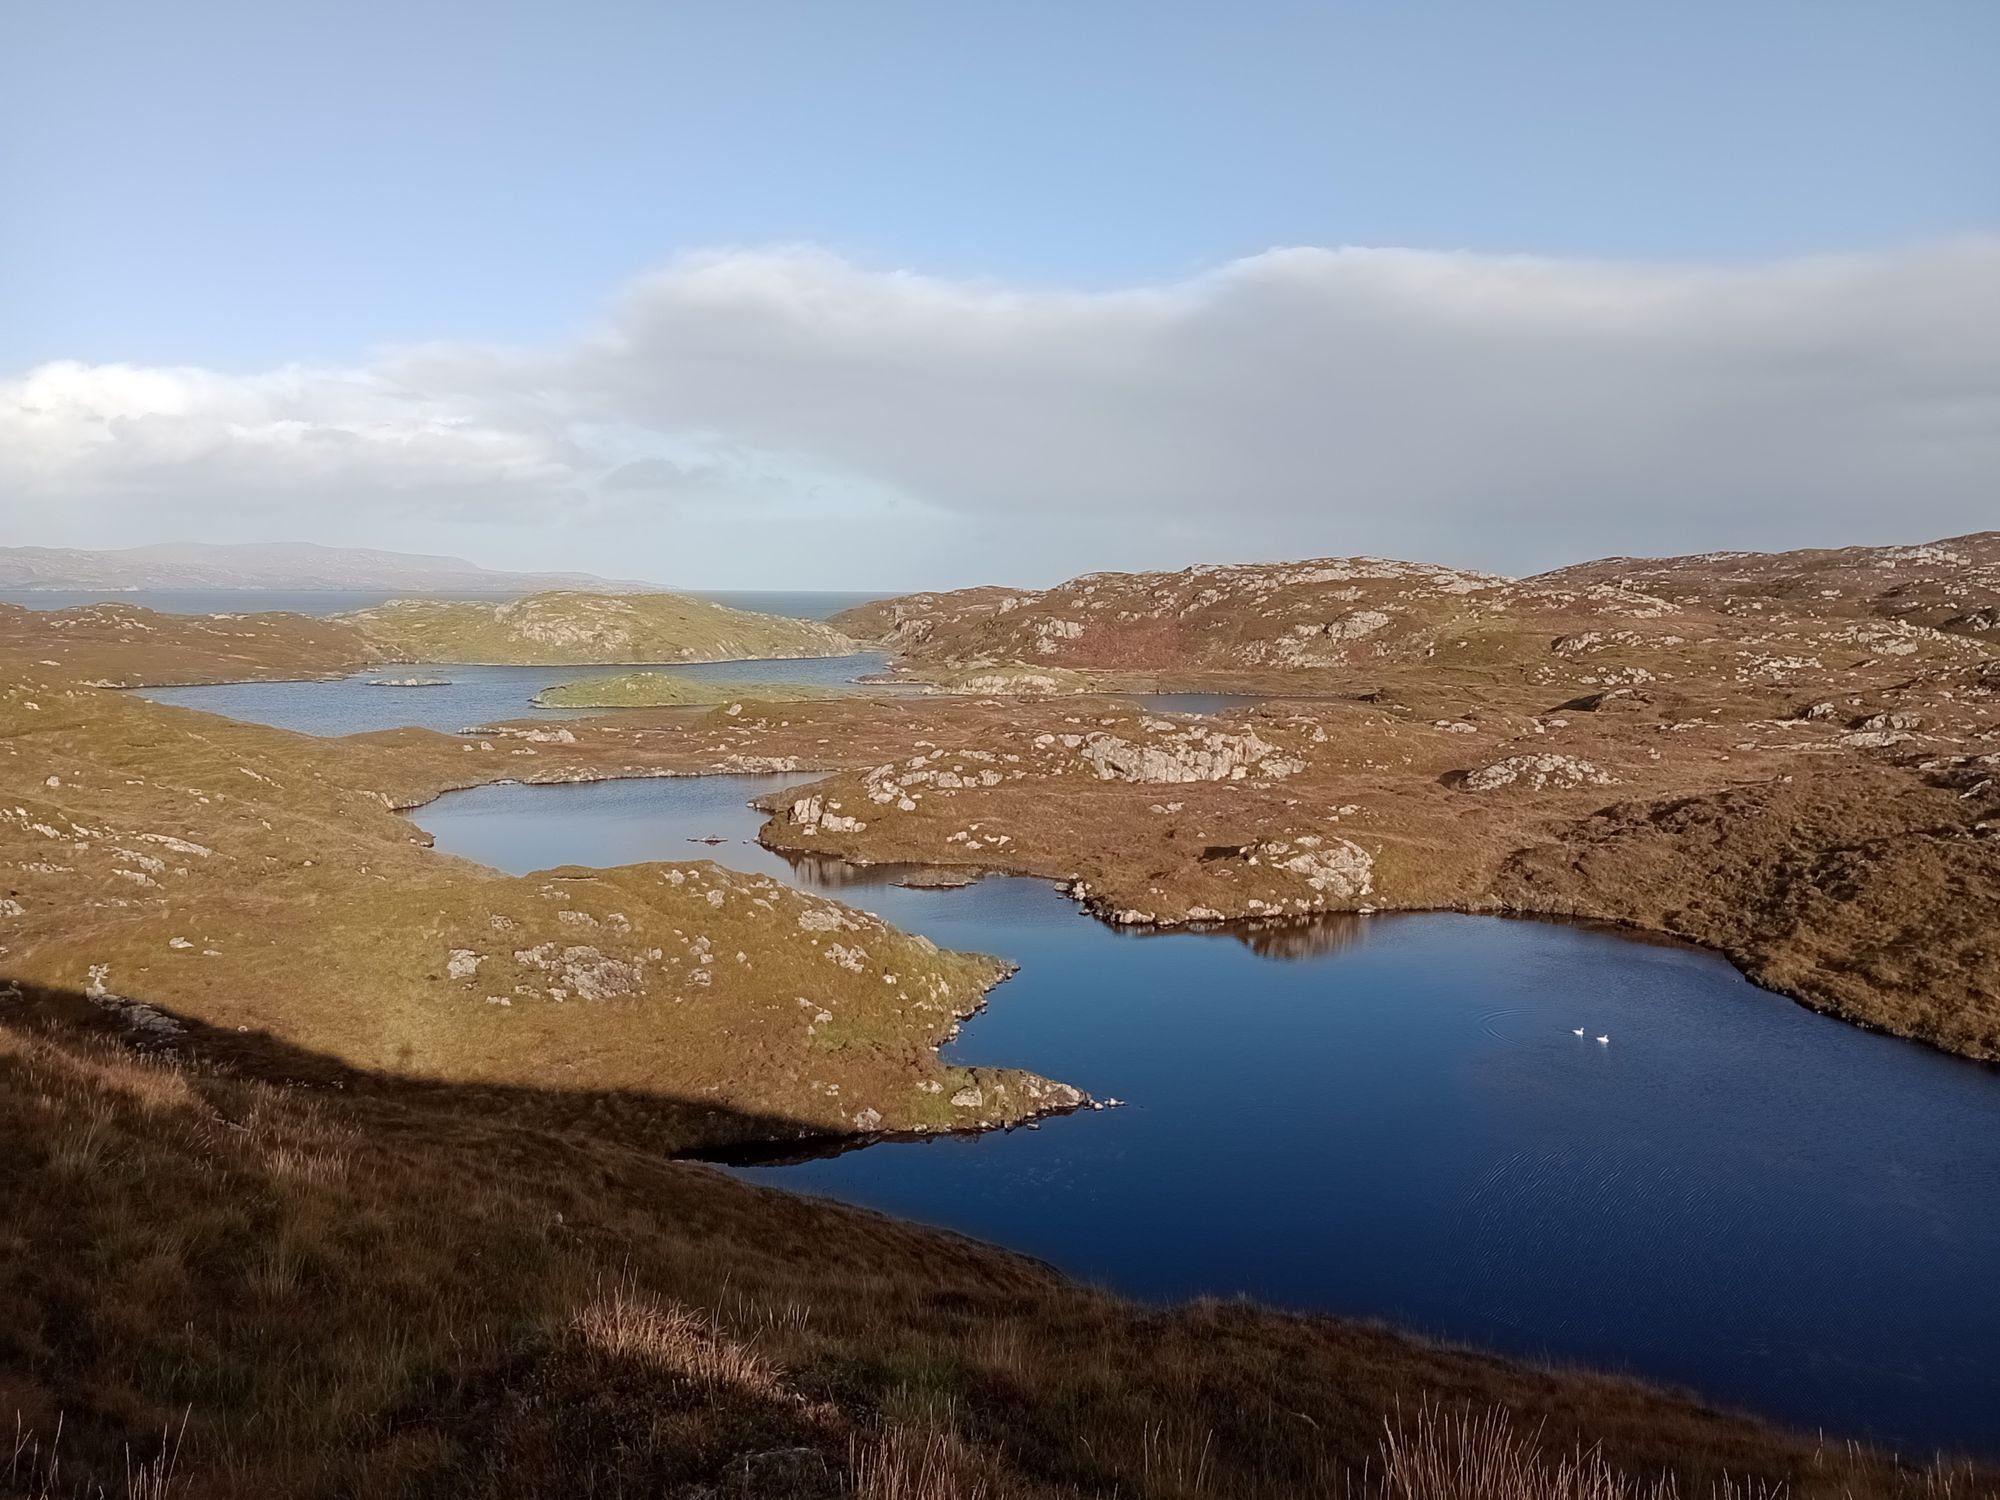
My friend and colleague Chris Smithard organises the amazing Coast and Islands orienteering week, which next summer is on the Isle of Harris. All of the maps are brand new for the week and in October 2022 we spent a week making one each.
My map was on the Isle of Scalpay, connected to Harris by bridge. A small area, 1km2 , but full of contour and rock detail. Chris kindly prepared the (georeferenced) base map using LiDAR data, OS MasterMaps and satellite imagery. Having a good base map not only means you end up with a more accurate final map, but the mapping process is easier too. It was then ready for me to work with in OpenOrienteering Mapper (which I'll call OOM, and is not to be confused with OpenOrienteeringMap - oomap.co.uk - a handy tool but more for street-O maps). OOM is a free alternative to OCAD, which is professional mapping software, though as I begin to do more mapping I will likely invest in OCAD.
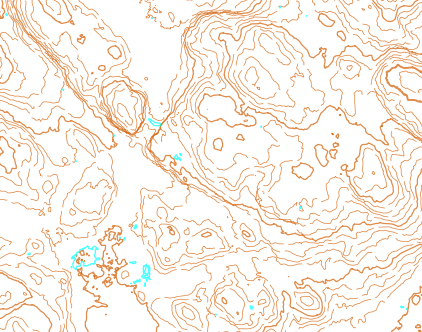
As you can see, the LiDAR contours (1m interval) are super accurate, especially for an open area like this, but quite jagged and messy. So, the first step for me was 'tracing' every 5th contour to get the 5m contours for the orienteering map, but with some smoothing so that they are clear and natural for the competitors to read. In hindsight, I think I traced out the LiDAR in slightly too much detail and the contours on the final map could be simplified and smoothed further. The 1m LiDAR shows much more detail than we can convey on a 1:10,000 orienteering map, but we can use form lines and knolls to keep the most obvious bits, for example a 3m high hill that falls between 5m contours.
To add features like crags, boulders, marshes and vegetation you actually have to visit the area and spend lots of time walking round it. For Scalpay I spent 4 full days on the area, using the OOM app on my phone, along with a stylus. This allows you to update the map in real-time, rather then the traditional method of taking paper notes and then updating the digital map afterwards. For this area, one of the main things I had to focus on was what counted as a crag - a 6ft steeply sloping bit of rock? What about 4ft but vertical? In the end I used a rule whereby if I could walk/step up it without using my hands, it definitely wasn't a crag. Bigger/steeper than that, it might be.
In hindsight, there are probably a few too many crags mapped. I think they were potentially tricky for the runners to pick out from afar, because slopey bare rock often didn't count as a crag. I was also unaware of the rule on minimum separation between crags (if you can pass between crags, the gap should be at least 0.15mm on the map), which makes the map look a little more untidy.
Another tricky issue was how to map marshes, given I was doing my fieldwork in October but the event is in July. Would the marshes and ponds I saw still be wet in summer? Again, you just have to use you're best judgment, including things like what sort of vegetation is growing there. (My apologies to those people who had a control on a pond which was now rather dry).
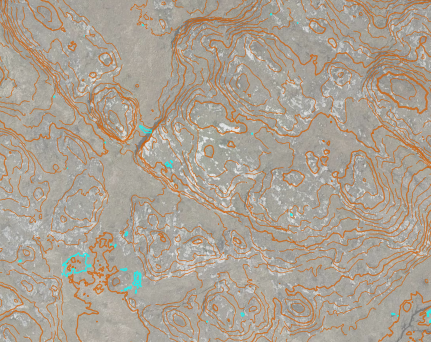
Point features: Say you come across a boulder and want to map it. You know fairly accurately where you are from the LiDAR data, which I always kept translucently in the background, but not always exactly. How about the satellite? Can you see an obvious grey spot on the satellite image? If you can, and it fits with the contours, then perfect! Making it match up with the contours is crucial actually, and there was one rocky pit where I didn't manage this quite perfectly. OOM also allows you to use the phone's GPS location, which on an open area like this was usually accurate to within 5m, so that helps too.
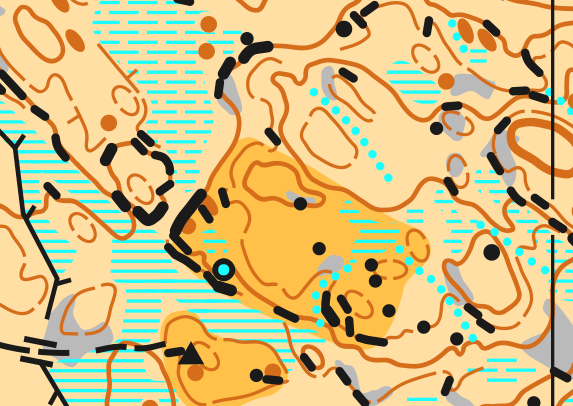
It is always a balance between showing all the detail you want to show, and keeping the clarity so that someone can read it whilst running flat out through the terrain. I hope you enjoyed running on the map!
No email today, since this was published last October, and then updated.